Heatmap for DEGs within differential loops.
Nevagation section
This section provided integration results centered by HiC data. H3K27Ac peaks, CTCF peaks, ATAC-seq peaks exist around the two ends of HiC loops were detecteded and integrated together. For each table, the first 6 columns gave location information of the left end and right end of the loop. The following columns indicated whether and which of the two ends had peaks around.
The differential analysis results for multi-omics data are provided for users to use. Some related heatmaps are also provided for users to see.
HiC loops that are different between normal cells and tumoral cells in various types of cancer .
The log fold changes and p-values of gene expressions between normal lung cells and lung adenocarcinoma (LUAD).
DEG (cutoff=0.05, normal vs LUAD) within differential loops between normal lung cells and A549 cell line (tumor-specific or normal-specific). DEGs whose start position and end position are both within terminals of differential loops are listed here.
DEG (cutoff=0.05, normal vs LUAD) with differential loops (tumor-specific or normal-specific) around its promoter region. DEGs whose transcription start site (TSS) +/- 5000bp has the left terminal of differential loops are listed here.
CTCF binding peaks sequenced by ChIP-seq that are different between normal lung cells and lung adenocarcinoma cells (A549 cell line).
H3K27ac peaks sequenced by ChIP-seq that are different between normal lung cells and lung adenocarcinoma cells (A549 cell line).
ATAC-seq peaks that are different between normal lung cells and lung adenocarcinoma cells (A549 cell line).
The comparison of mutations, differential expressed genes (DEGs), differential H3K27Ac regions across cancers were provided here.
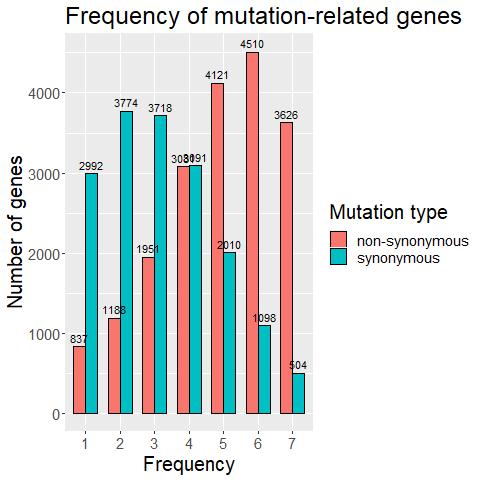
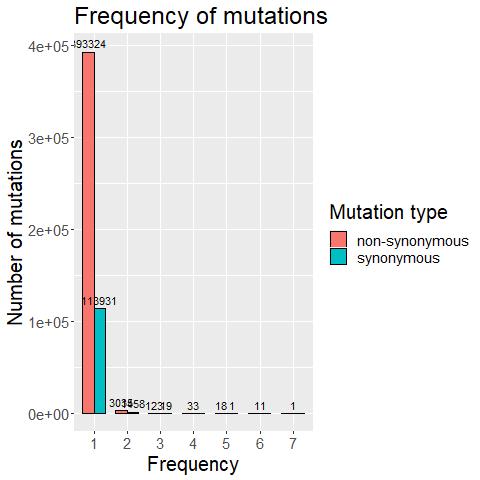
This section showed mutations that are different or common across 7 cancers: breast cancer, liver cancer, lung adenocarcinoma, lung squamous carcinoma, ovary cancer, pancreatic cancer, prostate cancer. Pie-chart of mutation frequency (exists in how many cancers) and Venn chart of detailed mutation distribution were shown separately for coding-region mutations, non-synonymous mutations and synonymous mutations.


Below showed functional enrichment analysis results for non-synonymous mutations-related genes that exist in all 7 or only 1 type of cancer (performed by enrichGO R package)
 LUSC-only
 Prostate cancer-only


Below showed functional enrichment analysis results for synonymous mutations-related genes that exist in all 7 or only 1 type of cancer (performed by enrichGO R package)
 LUAD-only
 LUSC-only
 Ovarian cancer-only


